Keil MDK Provides Effective Application Debugging for STM32
Developing quality embedded systems requires robust and effective debug features. Arm® Keil® MDK provide these via ST-Link, the integrated debug adapter of the popular STM32 Discovery and Nucleo boards. Now, the new ULINK™plus delivers insight into the power consumption of your embedded system, which helps verify the energy profile of your IoT application and optimize the device configuration.Keil MDK is based on the genuine Arm Compiler and offers CMSIS components including RTOS and various professional middleware libraries. It includes the easy-to-use µVision IDE which fully utilizes CMSIS software packs for scalable device support. The integrated debugger provides a single environment to test, verify, and optimize application code. The debugger includes all traditional features like simple and complex breakpoints, watch windows, and execution control and provides full visibility to device peripherals.
Watch the Video Tutorial: https://youtu.be/wDk6TDm4rYk

Arm Cortex-M debug interface
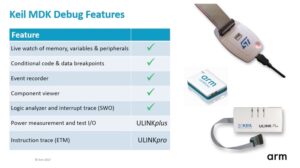
The Serial Wire Debug (SWD) interface uses just 2-pins to connect to the STM32 Cortex-M debug logic. MDK fully utilizes this on-chip debug logic and offers unique features such as:
- Live value display of memory, variables, and peripherals while the program runs at full speed, which is especially valuable for debugging embedded applications that so often depend on real-time execution.
- Conditional breakpoints that trigger on variable changes that can help locate sporadic program errors.
- Integrated Event Recorder and Component Viewer that shows event and status annotations of the application software.
Arm Cortex-M trace interface
STM32 devices that are based on Cortex-M3, M4, or M7 also support the Serial Wire Viewer (SWV) trace capability which is delivered via the SWO pin to the debugger. SWV trace is easy to configure and using it gives you in MDK additional debug features such as:
- Trace data window that captures time stamps, PC samples, exception execution, and specific memory accesses.
- Graphic of variable changes over time in the logic analyzer window.
- Timeline and detailed execution statistics of all interrupt service routines.
- Event counters that provide important performance indications during execution.
The MDK debug and trace features that are described above are even supported with the ST-Link interface, but the Keil ULINK™pro and ULINK™plus debug adapters offer a significant higher debug and trace bandwidth. ULINKpro also supports 4-pin ETM instruction trace that delivers full code coverage information and execution profiling for optimizing specific program algorithms.
Visit Arm Keil at the ST DevCon
Arm Keil will be at the ST Developers Conference in Santa Clara and are showing a live demo of these key debug features, available with Keil MDK in combination with STM32 devices. You can also talk to Arm Keil’s technical expert Bob Boys, the author of popular lab tutorials and application notes.
You may also visit www.keil.com to download an evaluation version of Keil MDK or Arm’s demo pod to get a special 90-day license offered only at the ST Developers Conference. From this web site, you can get the comprehensive Getting Started User’s Guide or explore the Learning Platform where you can find application notes and more video tutorials. The application note Using ST-Link/V2 and MDK 5 with Discovery/Nucleo Boards gives you further tips and tricks for software debugging and verification of your STM32 application.
Thank you for reading this blog and happy debugging with Keil MDK and STM32 devices.
